- Equity markets endured a volatile quarter, including a sharp sell-off in August and the long awaited first interest rate cut from the US Federal Reserve.
- Trupanion and NVR were among the top performers following strong earnings releases, while Cadence Design Systems weakened following softening sentiment in the semiconductor space.
- We sold our holdings in IQVIA and Markel, and we initiated positions in KLA Corporation and Core & Main.
The Liontrust GF Sustainable Future US Growth Fund returned 5.9% in US dollar terms in Q3, compared with the 5.8% return from the MSCI USA Index (its comparator benchmark) and the 6.0% return from the IA North America reference sector.
During the quarter, we celebrated the one year anniversary of the launch of the strategy. The Fund ended the quarter with assets of $107 million and has delivered a total return of 24.8% since launch, compared to 32.8% for the MSCI USA Index and 28.9% of the IA North America peer group. While the relative returns have been disappointing, given our overweight to small and medium-sized companies in the portfolio and our limited exposure to the mega-caps, we believe our returns have been acceptable.
We thought this piece would be an opportune moment for reflection on the portfolio so far. We will look at the turnover of the strategy and dissect the performance, with a particular focus on identifying where our out- (and under-) performance has stemmed from. Lastly, we will provide a brief overview of the reasons behind our trading activity in the quarter. Before we delve into the details, we would like to take the opportunity to thank our clients for their support and for their investment, it is an honour to manage your money and we feel privileged to be doing so.
Turnover since launch
It is rare to hear a fund manager claim they are short term; the phrase ‘long-term investing’ however means different things to different people, and we thought we would lay out the numbers behind our trading so far to allow you to draw your own conclusions.
The portfolio started with 43 holdings, we have exited 8 and replaced these with 8 others. Below are the companies we have sold, accompanied by the reason (stages 1 to 4 on our investment process) and whether the sale has so far proved to be correct (i.e. has it since underperformed our benchmark).
Fund disposals
|
Company |
Sector |
Company description |
Market cap at sale |
Date exited |
Reason for exit |
Performance relative to MSCI USA Index since sale[1] |
|
Hingham Institution for Savings |
Financials |
Regional bank |
$0.4bn |
Aug-23 |
3. Business fundamentals |
26% vs. 33% |
|
DocuSign |
Information technology |
e-signatures |
$8bn |
Oct-23 |
3. Business fundamentals |
59% vs. 41% |
|
Winmark |
Consumer Discretionary |
Second hand clothes stores |
$1.5bn |
Dec-23 |
4. Valuation |
-9% vs. 24%[2] |
|
Equinix |
Real estate |
Data centre |
$72bn |
Apr-24 |
3. Business fundamentals |
+22% vs. 15% |
|
Illumina |
Healthcare |
Gene sequencing |
$17bn |
Jun-24 |
3. Business fundamentals |
+24% vs. 6% |
|
Adobe |
Information technology |
Software |
$234bn |
Jun-24 |
3. Business fundamentals |
-1% vs. 6% |
|
Markel |
Financials |
Specialist insurance |
$19bn |
Aug-24 |
2. Sustainability |
5% vs. 11% |
|
IQVIA |
Healthcare |
Outsourced clinical trials |
$43bn |
Sep-24 |
2. Sustainability |
0% vs. 4% |
1 Performance measured from the point of sale until the 30th September 2024
2 We exited Winmark on the 18th December and repurchased shares on the 26th Jan, so the relative performance is measured until the date of repurchase
3 Performance measured from the point of purchase until the 30th September 2024
Fund additions
|
Company |
Sector |
Company description |
Market cap at purchase |
Date added |
Performance relative to MSCI USA Index since purchase[3] |
|
Trupanion |
Financials |
Pet insurance |
$1.2bn |
Aug-23 |
+45% vs. +33% |
|
Veralto |
Industrials |
Water testing and packaging |
$17.4bn |
Oct-23 |
+60% vs. $41% |
|
Winmark |
Consumer Discretionary |
Second hand clothes stores |
$1.2bn |
Jan 2024 |
+11% VS. 18% |
|
IRadimed |
Healthcare |
MRI safe IV pumps and monitors |
$0.5bn |
Apr-24 |
+21% vs. 14% |
|
ServiceNow |
Information technology |
Workflow management software |
$150bn |
Jun-24 |
22% vs. 6% |
|
West Pharma |
Healthcare |
Vials for biologics |
$24bn |
Jun-24 |
-9% vs. 6% |
|
Core & Main |
Industrials |
Distributor for water industry |
$10bn |
Aug-24 |
-6% vs. 11% |
|
KLA Corporation |
Information technology |
Semi conductor testing |
$98 |
Sep-24 |
10% vs. 7% |
A couple of things stand out from these tables. Firstly, we are agnostic to the size of the company if we believe it is a good fit for our process. The transactions have ranged from as small as $400 million in the case of Hingham to as large as $234 billion for Adobe.
The second thing to note is that we are keen to discuss the performance of companies we have exited. This is important, as stocks that are sold but subsequently perform strongly will not show up in attribution, but the decision will still hurt performance. So far five out of our eight sales have underperformed the index since our exit and on the purchase side the score is the same, with five outperforming the benchmark. Such short time frames are hard to draw any strong conclusions from, but we want to be as transparent as possible with our investors in sharing both good and bad news.
So eight exits and purchases in a little over a year from a starting portfolio of 43 names suggests turnover of 19%. If we simply sum the total weight in the portfolio that was sold (or purchased) in these names then the figure is considerably smaller. Our time horizon remains five years and so you would expect, in normal market conditions, for our turnover to approximate 20% a year. Low levels of turnover is important for two reasons. Firstly we are behaving in line with our long-term time horizon and secondly, such low levels help minimise trading costs that can eat into performance.
Market cap bias
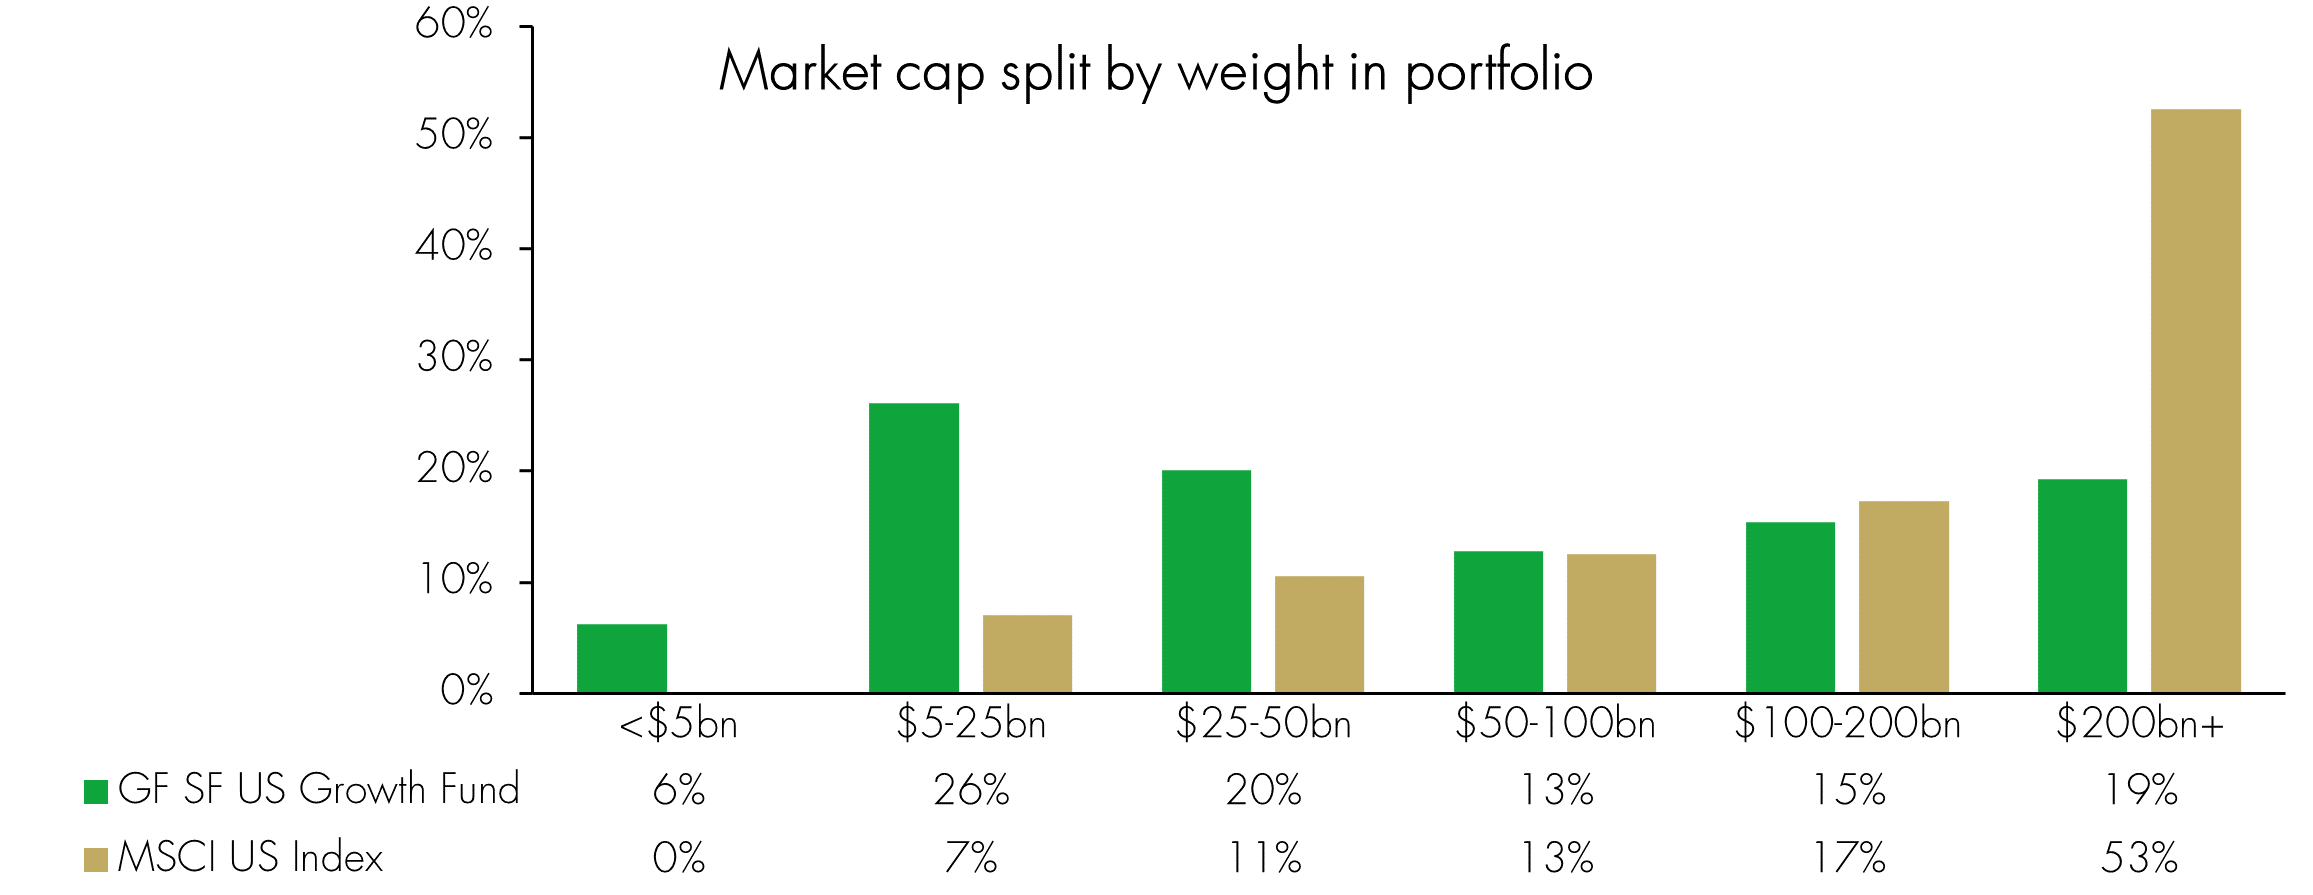
Our investment process starts with identifying sustainability shifts in our economy and finding the companies that are most likely to be positively impacted by these shifts. As such, we tend to steer away from the mega-cap companies that have driven the markets higher over the past 12 months or so, and instead have a much larger bias towards smaller and medium-sized companies.

As you can see, the benchmark now has over half the index in companies with market capitalisations above $200 billion, compared to just 19% for our portfolio. At the other end the difference is even more stark, our fund has 52% in companies with market capitalisations below $50 billion, compared to just 18% for the benchmark.
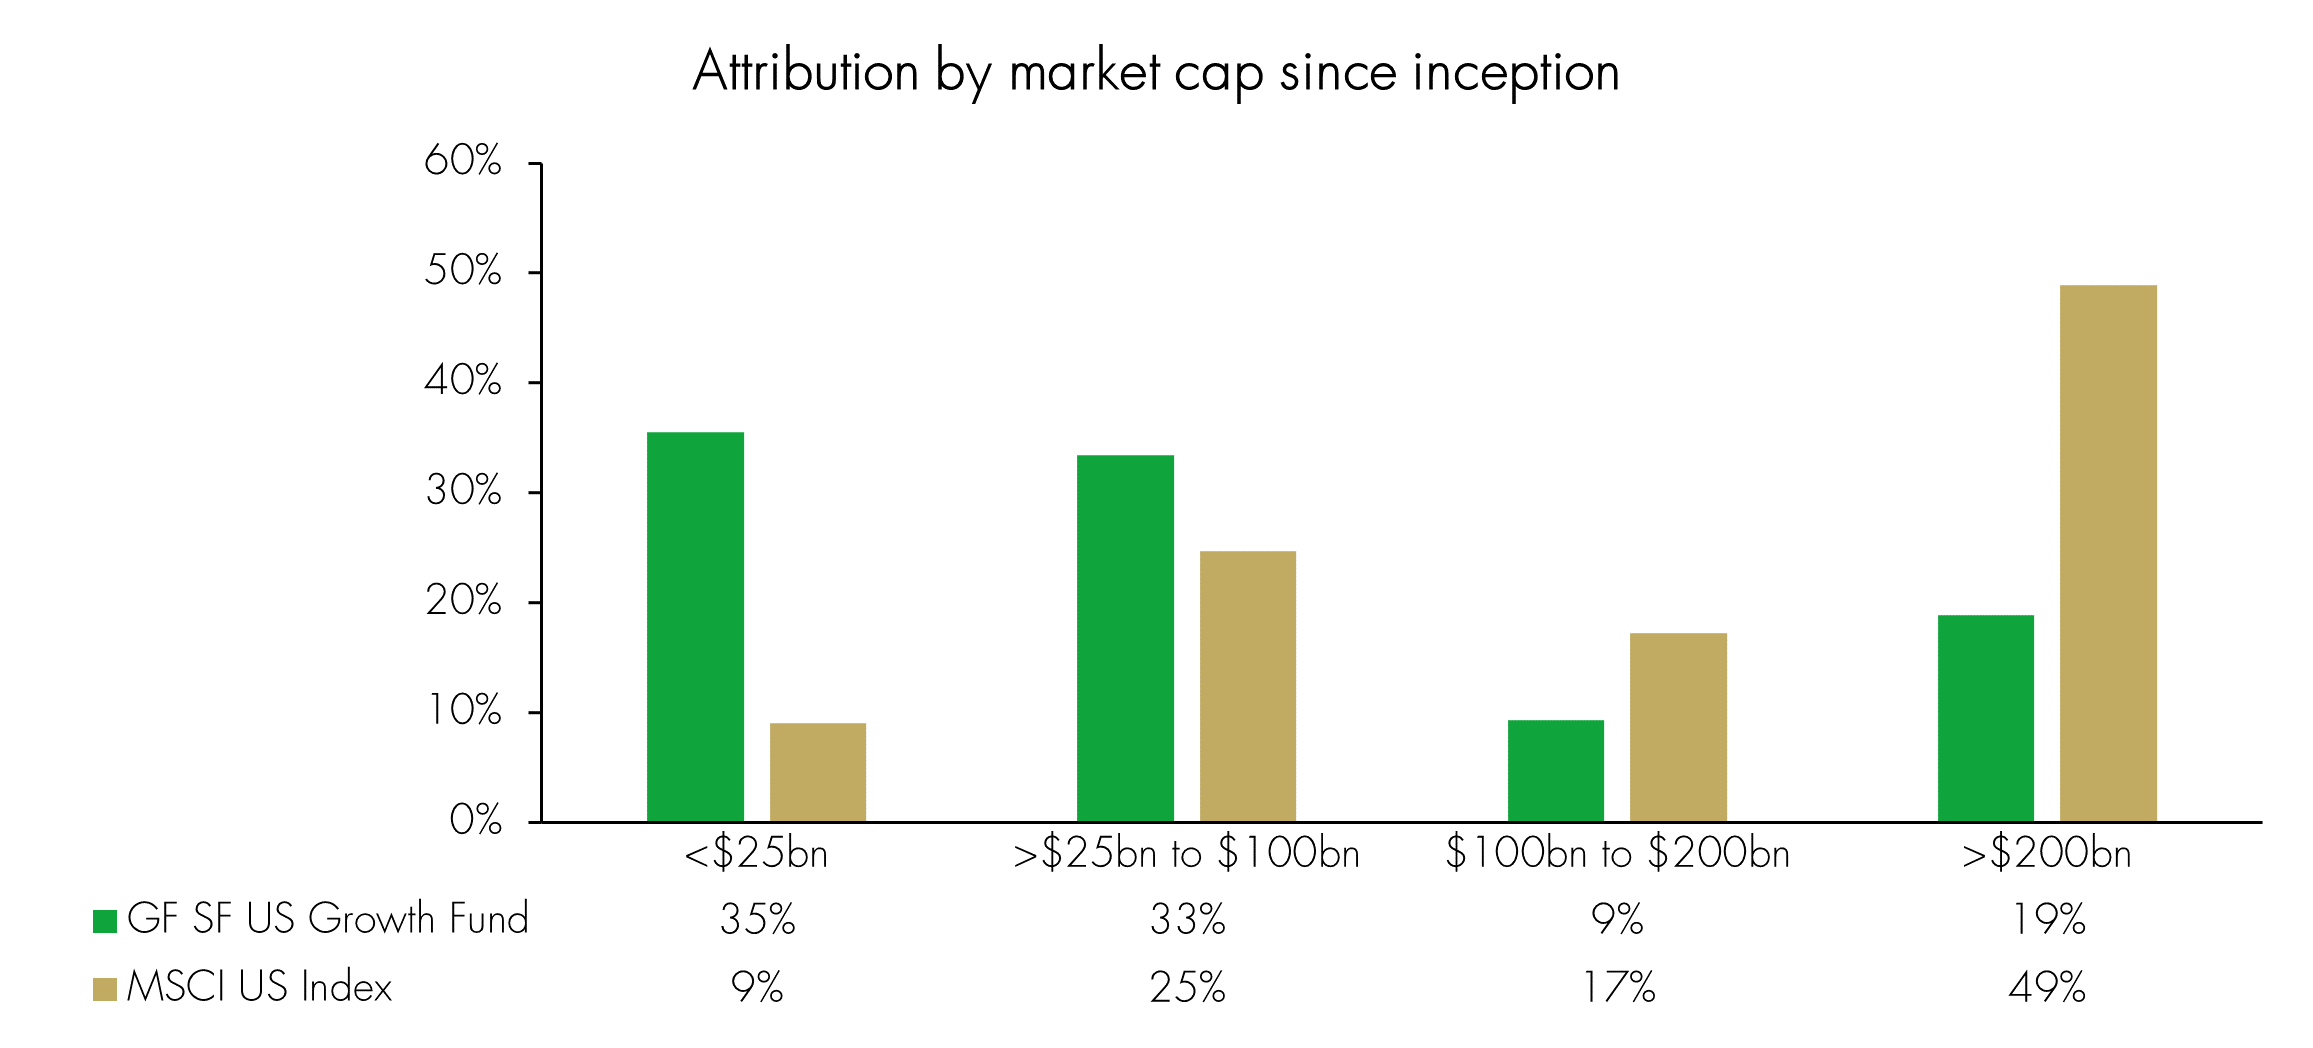
That’s all very well but what about our stock selection? We thought it may be instructive to breakdown where our stock picking has been fruitful, and where it has lagged. The chart below shows the areas of the market where we have had the most success in our stock selection. It also shows that our picks in the mega cap (greater than $200 billion category) have lagged the market. Our strongest areas of performance have so far come from the $25 billion to $100 billion and less than $25 billion buckets.

Source: Liontrust, FactSet, performance of the Liontrust GF US Growth fund vs. MSCI United States from 7th July 2023 to 30th September 2024.
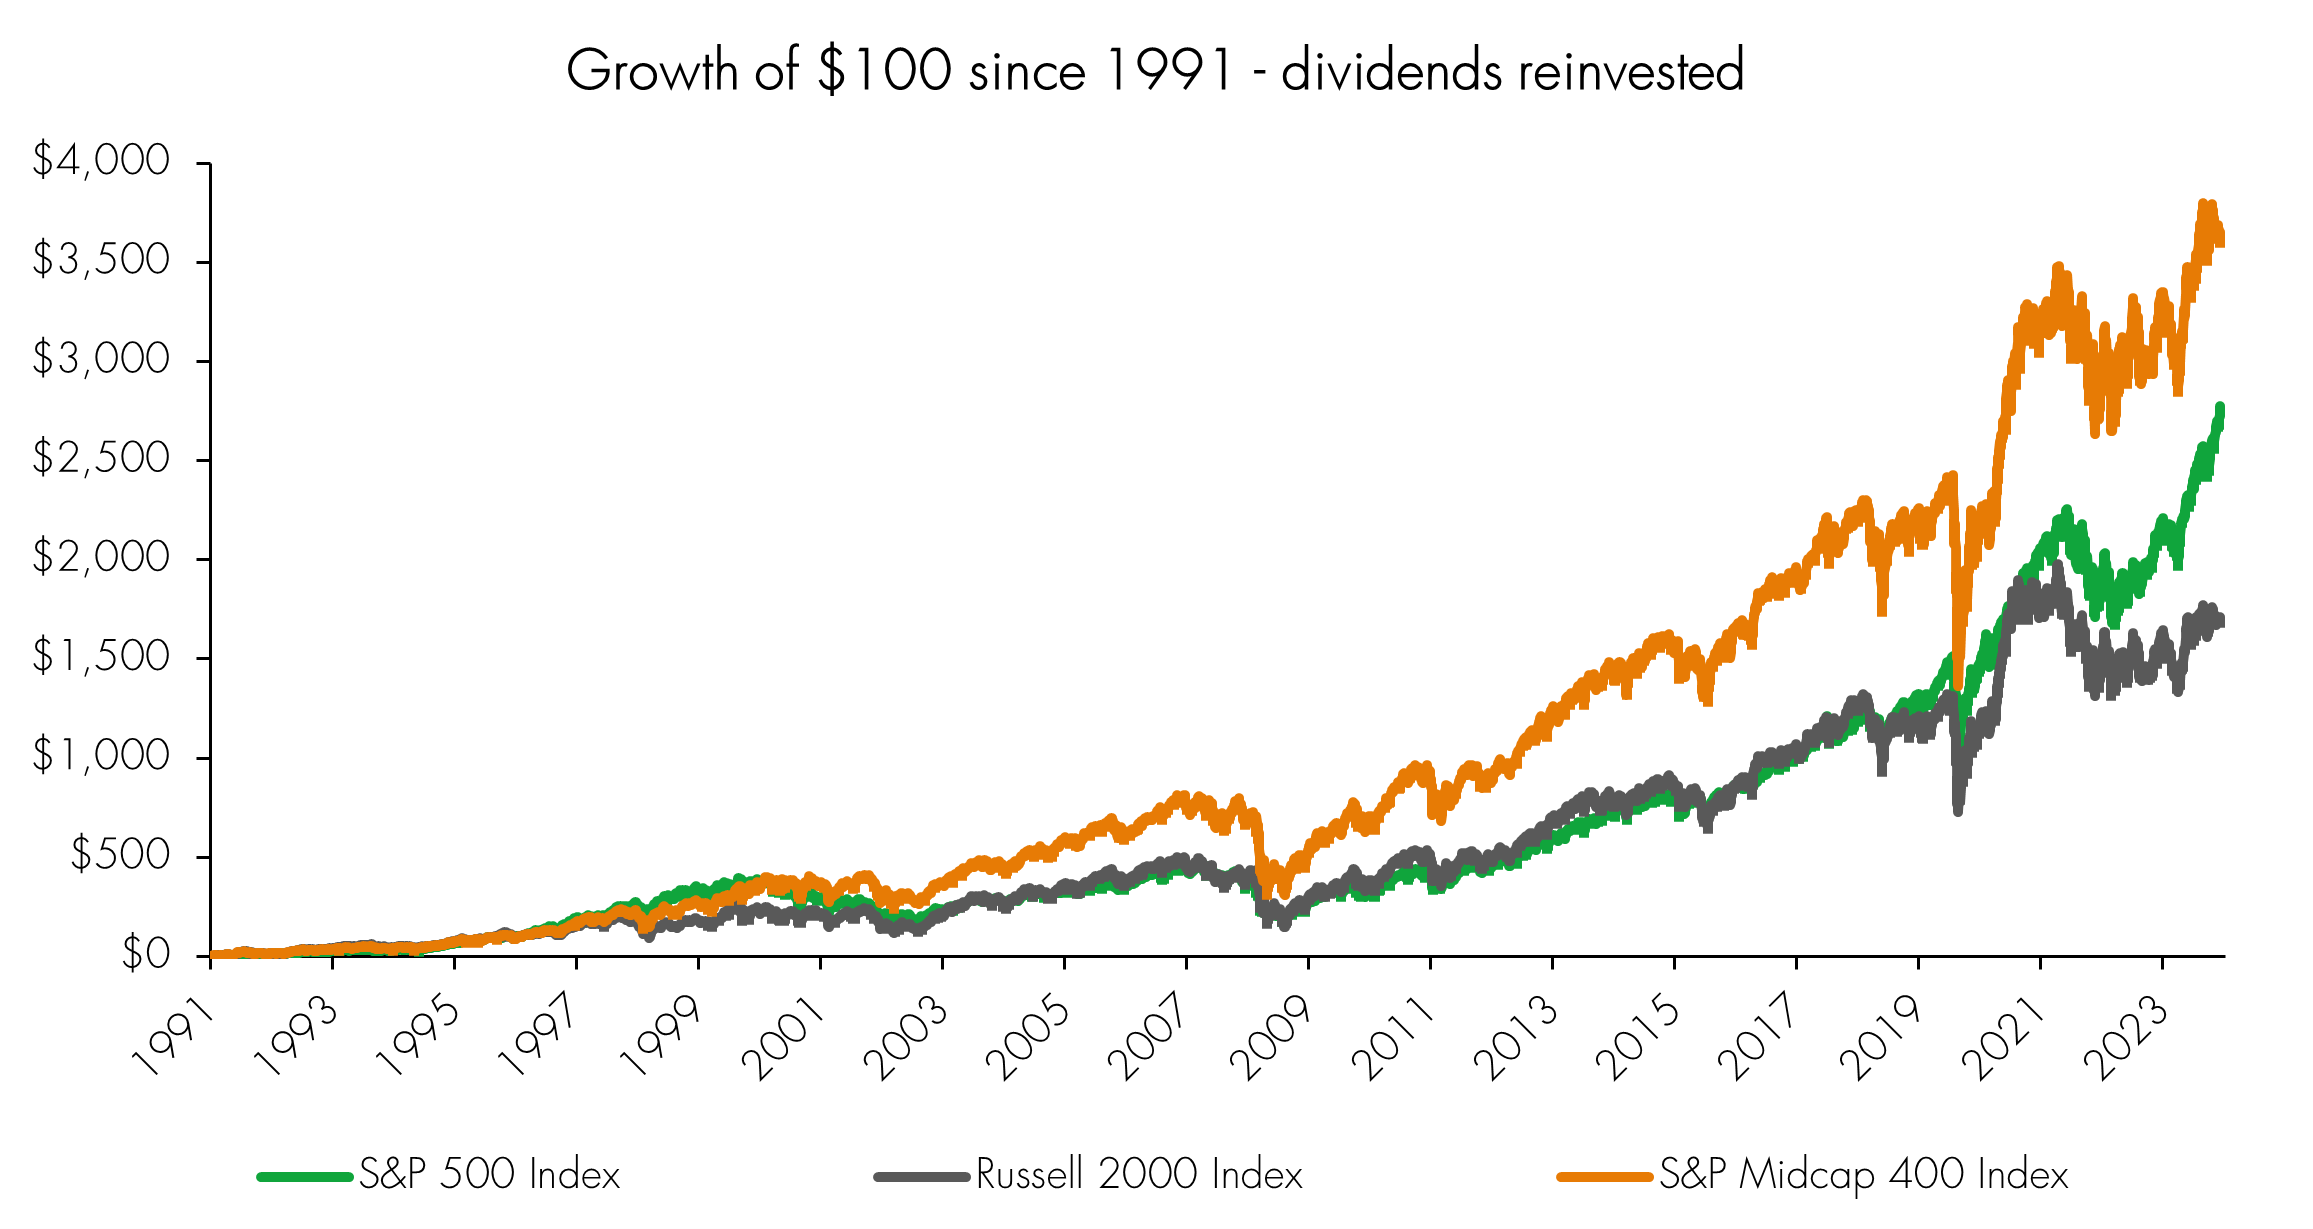
To be clear, we are not complaining about these market dynamics, we just thought it would be helpful to demonstrate where our success has come from so far. Should small- and mid-caps come back into favour, as has often been the case historically following a rate cut cycle, we anticipate that our portfolio would be well positioned. Despite the unusually strong performance of mega-cap stocks of late, longer term, mid-caps have delivered the strongest performance.
Over the long run, mid-caps have generated superior investment returns in the US

Source: Liontrust, Bloomberg as at 11.07.24
Turnover in the quarter
In terms of trade activity for the most recent quarter, we added Core & Main, the US distributor of pipes, valves and fittings that help disperse and control the flow of water and wastewater transmissions under our Improving the management of water theme. Its products have outsized benefits from an environmental perspective, given the importance of managing water and water infrastructure effectively. The wastewater products enable water to be reclaimed and are used in a variety of applications from industrial processes to agricultural irrigation.
We also added KLA Corporation, the market leader in process control inspection and metrology, under our Better monitoring of supply chains and quality control theme. KLA’s machines help to identify defects in chips throughout the semiconductor manufacturing process, helping to improve production yields, reduce waste, and prevent defective products being sent to customers.
In terms of sales, we exited our holdings in both IQVIA and Markel for similar reasons. Both businesses were four rated (our lowest from a management of ESG issues) on our sustainability matrix. This meant that both companies were targets for engagement to improve their approach to managing key sustainability topics. After repeated attempts, we were not successful and we concluded we were unlikely to be so in the medium term. We had other concerns about the businesses, the debt profile (and floating nature) at IQVIA for instance, and the insurance underwriting results at Markel, but our concerns around management of key ESG topics was the primary reason for exiting.
Discrete years' performance (%) to previous quarter-end**:
|
|
Sep-24 |
|
Liontrust GF Sustainable Future US Growth B5 Acc USD |
29.0% |
|
MSCI USA |
35.6% |
*Source: FE Analytics, as at 30.09.24, primary share class (A5), in euros, total return, net of fees and income & interest reinvested. 10 years of discrete data is not available due to the launch date of the fund.
Key Features of the Liontrust GF SF Global Growth Fund
KEY RISKS
Past performance is not a guide to future performance. The value of an investment and the income generated from it can fall as well as rise and is not guaranteed. You may get back less than you originally invested.
The issue of units/shares in Liontrust Funds may be subject to an initial charge, which will have an impact on the realisable value of the investment, particularly in the short term. Investments should always be considered as long term.
All investments will be expected to conform to our social and environmental criteria. Overseas investments may carry a higher currency risk. They are valued by reference to their local currency which may move up or down when compared to the currency of the Fund. This Fund may have a concentrated portfolio, i.e. hold a limited number of investments. If one of these investments falls in value this can have a greater impact on the Fund's value than if it held a larger number of investments. The Fund may encounter liquidity constraints from time to time. The spread between the price you buy and sell shares will reflect the less liquid nature of the underlying holdings. Outside of normal conditions, the Fund may hold higher levels of cash which may be deposited with several credit counterparties (e.g. international banks). A credit risk arises should one or more of these counterparties be unable to return the deposited cash. Counterparty Risk: any derivative contract, including FX hedging, may be at risk if the counterparty fails.
DISCLAIMER
This is a marketing communication. Before making an investment, you should read the relevant Prospectus and the Key Investor Information Document (KIID), which provide full product details including investment charges and risks. These documents can be obtained, free of charge, from www.liontrust.co.uk or direct from Liontrust. Always research your own investments. If you are not a professional investor please consult a regulated financial adviser regarding the suitability of such an investment for you and your personal circumstances.
This should not be construed as advice for investment in any product or security mentioned, an offer to buy or sell units/shares of Funds mentioned, or a solicitation to purchase securities in any company or investment product. Examples of stocks are provided for general information only to demonstrate our investment philosophy. The investment being promoted is for units in a fund, not directly in the underlying assets. It contains information and analysis that is believed to be accurate at the time of publication, but is subject to change without notice. Whilst care has been taken in compiling the content of this document, no representation or warranty, express or implied, is made by Liontrust as to its accuracy or completeness, including for external sources (which may have been used) which have not been verified. It should not be copied, forwarded, reproduced, divulged or otherwise distributed in any form whether by way of fax, email, oral or otherwise, in whole or in part without the express and prior written consent of Liontrust.


