The Liontrust Income Fund seeks to offer attractive total returns to its investors while delivering dividend income above the FTSE All Share Index. October (-393bps) was a torrid month for the fund and markets as government bond yields (the risk free rate against which stocks are measured) rose to 16 year highs and geopolitical issues in the Middle East exploded to the fore. Most stocks that failed to tick boxes of ‘defensive’ or ‘oil-related’ were sold off. Performance year-to-date (YTD) deteriorated on an absolute basis, now tracking a total return of 0.59%, while remaining ahead relative to our benchmark (+26bps).YTD the fund is in the top quartile of IA UK Equity Income comparator group.
The top contributor to performance in October was Var Energi (+19bps),a Norwegian oil & gas business, after reporting robust results as oil and gas prices rose. Reflecting a turbulent market, other top contributions came from relatively acyclical businesses; personal lines insurer Admiral (+13bps)and multi-utility provider Telecom Plus (+12bps).
The biggest detractor from October’s performance was Pets at Home (-51bps) which continued to digest the UK CMA investigation into the veterinary market. We profiled our holding in the company in last month's newsletter. Having pulled back by c.25% between the start of September and the end of October, we added to the position post-period end. Despite being a relatively smaller position, a sizable negative reaction to weak Q3 numbers saw Rentokil (-49bps) as another material detractor in the month. Unlike our decision to cut quickly in St James’ Place, we see this update as a cyclical bump, rather than thesis-breaking development, although we continue to monitor and debate the position.
Undervalued or just cheap: how the “justified P/E ratio” helps sort the wheat from the chaff
In this newsletter, as a change from our usual company profile, we decided to shine a light on our investment process and specifically, how we use 'justified multiples' as part of our valuation toolkit.
We tend not to be overly dogmatic on the virtues of one valuation method over another. We find it more helpful to tackle an inherently complex, organic problem with a broad toolkit. By the time we make an investment it's likely we have used a number of approaches to assess “fair value” – discounted cash flow (DCF), sum of the parts, yield or multiples-based, usually across a range of scenarios. Our work involves applying scientific valuation methods to typically murky real-life situations. It’s rarely straightforward and often involves “mental models” – heuristics, rules of thumb or maps – to navigate this process.
Valuation multiples, such as price to earnings (P/E), enterprise value to earnings before interest, tax, depreciation and amortisation (EV/EBITDA), and dividend yield, are some of the most commonly applied mental models in investing. They can certainly be useful as they are quick to calculate and simplify the complexities of valuation into a single, comparable number without relying on extensive information and assumptions. However, this can be a double-edged sword and we often see multiples applied in potentially oversimplified ways – low multiple stocks being classed as “cheap” and high multiple stocks as ”expensive”, for instance. But by applying the principle that valuation is ultimately a function of growth in cashflow, incremental returns and cost of capital, any investor can develop a more consistent analytical framework and better intuition when applying multiples.
If you were to go to a car showroom and see a new Ford for sale for $20,000 alongside a new Ferrari priced at $30,000, most of us would intuitively conclude (through our mental models) that despite costing 50% more, considerably better value exists in the Ferrari. Others might go away and research the brands, compare the engines, design, interior and potential resale value before reaching the same answer. Valuing stocks ultimately boils down to a similar process of appraisal.
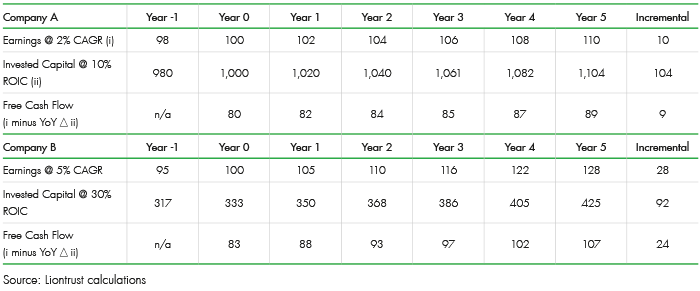
Let's apply this concept through the lens of the P/E multiple by applying a deconstructed Gordon Growth Model (GGM). We won’t work through the underlying formula of the GGM here but suffice to say it allows us to calculate a theoretically justified P/E ratio where we have estimates of a company's sustainable earnings growth rate, return on equity (RoE) and cost of equity (CoE). So is Company A, trading on a P/E multiple of 10x, a more attractively valued opportunity than Company B, which we could buy at 16x? Firstly, let's consider growth rates – Company A is expected to grow its earnings by 2% per annum, whereas Company B grows at 5%. Next, RoE – Company A generates a RoE of 10% from its earnings, whereas Company B achieves 30%. For argument’s sake we’ll assume both companies’ CoE is c.9%, broadly equivalent to the long-run average return of the global stock market.
Considered purely in terms of this financial outturn, Company B is clearly more attractive. In five years’ time its earnings will have grown from a starting index of £100 to £128 whereas Company A will be indexed at £110. Moreover, because Company B is a higher RoE business, it has required less incremental capital (stores, inventory, machinery, factories, data centres, etc.) to enable that growth. It has had to reinvest £92 whereas Company A has absorbed a greater proportion (£104). As shown in the table below, this enables Company B to generate more excess (“free”) cashflow, which it could either return to shareholders or deploy on other interesting projects.

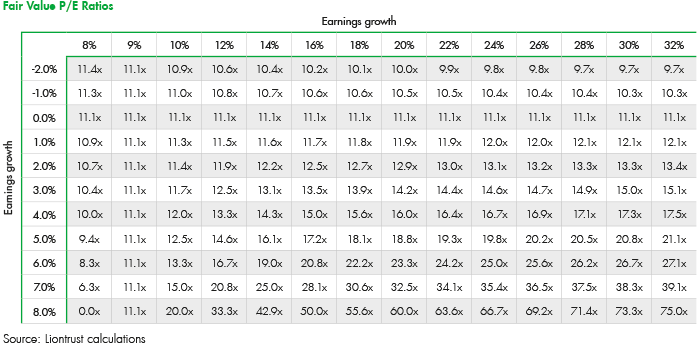
So, we've established that Company B offers a more attractive FCF growth profile and (because FCF is the ultimate driver of shareholder value creation) it should ordinarily command a higher multiple than Company A. But what sort of premium is justified? The table below shows this across a range of sensitivities for both growth and RoE, assuming a constant CoE of 9%. Reading from this we can see that Company A (2% growth; 10% RoE) should trade at 11.4x, whereas Company B (5% growth; 30% RoE) justifies a 20.8x multiple. So, Company A trading at 10x P/E looks about 12% undervalued, while company B, although optically much more “expensive” on 16x P/E, actually appears better “value” (roughly 25% undervalued).

Bringing this back from the textbook to the real world, let’s think about Greggs, a company we admire and track closely, although not currently one of our portfolio holdings. Its UK food-to-go business has been (temporarily we believe) disrupted by the Covid pandemic and so we find it more meaningful to look at either its historic P/E multiple of 23.5x (FY19) or its prospective 20.6x (FY23e, per Bloomberg). While this may sound like a rather fancy multiple, consensus expects Greggs to deliver strong growth over the next 5-10 years, with net new store openings of c.100 each year adding c.4-5% per annum to its topline; plus, potential for like-for-like sales growth of c.5-10% per annum, supported by growth in home delivery, its nascent evening meal offering, and customer frequency driven by its new loyalty app. Its model has delivered RoE of c.30% in recent years. Greggs seems to us more a Ferrari of a business model than a Ford. Such elevated levels of growth won't last forever, of course, and some form of mean reversion in the multiple needs to be expected. But when the combination of potential double-digit mid-term growth and high returns are taken into account, today’s valuation arguably starts to look more reasonable.
Simple but effective tools like justified multiples are something we find very helpful when considering both spot valuations but also scenarios if, for example, growth rates were to accelerate or decelerate. More broadly, we hope this article explains why we find screening for “undervalued” rather than just “cheap” dividend paying stocks to be the most fruitful hunting ground for profitable investments. Without wishing to sound trite, we are reminded of one of the great Charlie Munger quotes: "The investment game always involves considering both quality and price, and the trick is to get more quality than you pay for in price. It’s just that simple." We couldn’t put it better.
Fund performance year-to-date has been satisfactory in a challenging market. We are, though, focused on the more substantial opportunity that exists to grow our investors' wealth and dividend income over the long-term (and indeed our own, as substantial investors in the strategy). We remain confident that our process, identifying dividend paying companies with Competitive Powers, gives us a framework to capture superior risk adjusted returns. As ever, we thank you for your interest and continued support.
KEY RISKS
Past performance is not a guide to future performance. The value of an investment and the income generated from it can fall as well as rise and is not guaranteed. You may get back less than you originally invested.
The issue of units/shares in Liontrust Funds may be subject to an initial charge, which will have an impact on the realisable value of the investment, particularly in the short term. Investments should always be considered as long term.
Bonds are affected by changes in interest rates and their value and the income they generate can rise or fall as a result; The creditworthiness of a bond issuer may also affect that bond's value. Bonds that produce a higher level of income usually also carry greater risk as such bond issuers may have difficulty in paying their debts. The value of a bond would be significantly affected if the issuer either refused to pay or was unable to pay. This Fund may have a concentrated portfolio, i.e. hold a limited number of investments. If one of these investments falls in value this can have a greater impact on the Fund's value than if it held a larger number of investments. The Fund may encounter liquidity constraints from time to time. The spread between the price you buy and sell shares will reflect the less liquid nature of the underlying holdings. Outside of normal conditions, the Fund may hold higher levels of cash which may be deposited with several credit counterparties (e.g. International banks). A credit risk arises should one or more of these counterparties be unable to return the deposited cash. Counterparty Risk: any derivative contract, including FX hedging, may be at risk if the counterparty fails. The level of income is not guaranteed.
DISCLAIMER
This is a marketing communication. Before making an investment, you should read the relevant Prospectus and the Key Investor Information Document (KIID), which provide full product details including investment charges and risks. These documents can be obtained, free of charge, from www.liontrust.co.uk or direct from Liontrust. Always research your own investments. If you are not a professional investor please consult a regulated financial adviser regarding the suitability of such an investment for you and your personal circumstances.
This should not be construed as advice for investment in any product or security mentioned, an offer to buy or sell units/shares of Funds mentioned, or a solicitation to purchase securities in any company or investment product. Examples of stocks are provided for general information only to demonstrate our investment philosophy. The investment being promoted is for units in a fund, not directly in the underlying assets. It contains information and analysis that is believed to be accurate at the time of publication, but is subject to change without notice. Whilst care has been taken in compiling the content of this document, no representation or warranty, express or implied, is made by Liontrust as to its accuracy or completeness, including for external sources (which may have been used) which have not been verified. It should not be copied, forwarded, reproduced, divulged or otherwise distributed in any form whether by way of fax, email, oral or otherwise, in whole or in part without the express and prior written consent of Liontrust.


