- Volatility has spiked after SVB’s failure, but bond market volatility was already rising due to 2022’s rapid rise in interest rate expectations.
- Rising volatility presents us with more opportunities to use our full set of investment tools, as we apply a strategic approach to bond markets.
- In 2020, volatility spiked across all asset classes, and we found the best way to exploit this was to increase corporate bond exposure to target more attractive credit spreads.
- In 2022, bond markets rapidly repriced to reflect higher interest rates expectations. The purest way to reflect this shift was to increase portfolio duration (interest rate risk) and access higher yields.
- But we also target alpha through less directional measures – by taking views on the shape of the yield curve for example.
- Interest rate expectations have fluctuated dramatically so far in 2023, providing fertile conditions for these additional alpha-generation measures.
- The SVB failure has accelerated the bond market’s transition to more historically normal levels of market volatility and an environment which will reward an active investment approach.
Reverberations from Silicon Valley Bank’s (SVB) failure have been felt around the globe and across asset classes. However, the jump in market volatility may be more of a shock to equity investors than to bond investors who, like us, have been observing heightened volatility for much of the last twelve months.
Far from a negative development, the return of volatility has been most welcome after a decade-plus of financial markets volatility being massively and artificially suppressed by extraordinary monetary stimulus – ultra low interest rates and huge bond-buying quantitative easing programmes.
As strategic investors in bond markets, we have a number of levers we can adjust to exploit different potential sources of alpha. For example, we can manage overall exposure to duration (interest rate sensitivity) but the opportunity to take investment views on rates encompasses so much more: yield curve positioning, cross-market trades and inflation break-evens to name a few.
Volatility in itself doesn’t automatically signal that bonds as an asset class are cheap, but it does tend to indicate a much larger opportunity set. While we can still tweak alpha sources to target returns in a low yield, low volatility environment, the 2022 market repricing has significantly improved the investment landscape and brought our full investment toolkit into play.
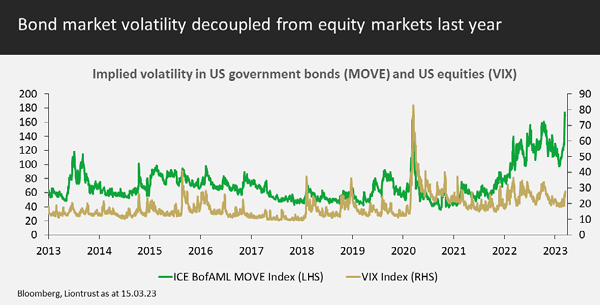
The chart above shows volatility for both equity and bond markets, both measures derived from option prices. The VIX (Chicago Board Options Exchange Volatility Index) plots volatility for S&P 500 companies while the ICE BoA MOVE index tracks the volatility of US government bond prices.
As markets repriced in 2022 to reflect persistent inflation and higher rates, this triggered a decoupling of bond market and equity market volatility. This contrasts with March 2020, when both measures spiked as the Covid pandemic escalated.
These patterns have an impact on which investment risks we are willing to take in pursuit of the best returns. In 2020, for example, the widespread nature of volatility and risk aversion led credit spreads to widen to very attractive levels, and we therefore increased corporate bond exposure.
We chose to keep duration low at this time; we’d effectively already deployed the Fund’s ‘risk budget’ by raising credit risk, and there was little prospect at the time of government bonds offering a compelling case for more duration risk, given the outlook for ongoing low central bank rates.
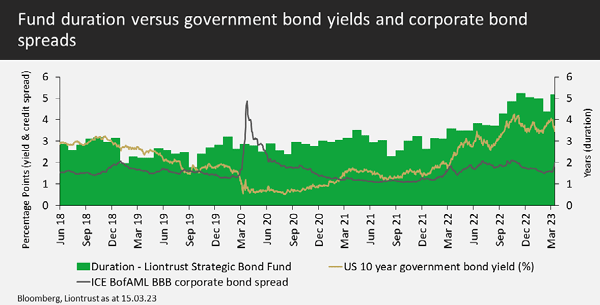
In 2022, by contrast, government bond markets began to look a lot more attractive as yields rose to reflect rampant inflation and central bankers playing catch-up. This volatility in interest rate expectations is far more apparent in the MOVE index – as investors priced in rising rates, before grasping for signs of a pivot to rate cuts – than it is for the VIX index.
This meant that credit spreads – the more equity-like portion of a corporate bond’s return profile – didn’t widen to the same extent as underlying benchmark government bond yields rose. In this environment, we felt that fund risk budget was best allocated to reaping the higher yields offered by bonds, while also exploiting the volatility in interest rates expectations where possible.
In the second half of 2022, we increased duration above our neutral level of 4.5 for the first time since the strategic funds launched in 2018 and we have been very active in dynamically managing it around this level to capture the fluctuations in yields as ‘peak rate’ forecasts have see-sawed in both scale and timeline.
While credit spreads were fair, they remained relatively tight, reflective of lower volatility in credit and equities, so we kept our corporate bond exposure close to our neutral level of 50% in investment grade and 20% high yield.
So far in 2023, there has been no let-up in bond market activity, with interest rate expectations fluctuating dramatically during the first quarter, as illustrated below. The US yield curve initially rallied down from position 1 to 2 in January as rate pivot expectations built, before shifting out to 3 again – higher than its position at the start of the year – after stronger than expected macroeconomic data and hawkish comments from the Fed chair Jay Powell. Finally, the SVB failure prompted another jolt downwards in yields (to 4), as investors anticipated an easing of monetary policy to aid financial stability.
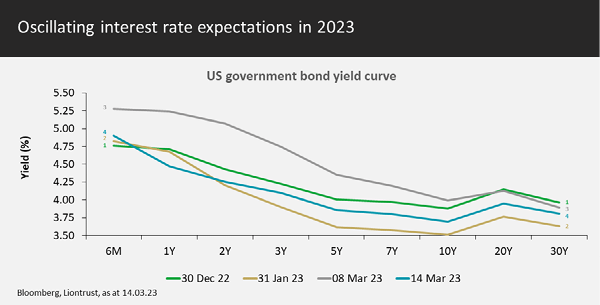
These kind of seismic moves in the bond market create opportunities for us to generate additional alpha – not just by dynamically adjusting overall duration, but also by expressing views on the shape of the yield curve.
For example, the inversion of the US yield curve has recently received a lot of attention due to its record of portending a recession. When the 10-year bond yield is lower than the 2-year yield, it is thought to be inverted; the ‘US 2s10s’ measure simply detracts the 10-year yield from the 2-year, returning a negative figure when inverted.
In early March, Powell succeeded in convincing markets of his inflation-fighting determination, leading them to price in a reversion to a 50 basis point hikes at the next rates decision later this month. As a result, the yield curve inversion between 2-year and 10-year yields hit levels not seen since 1981.
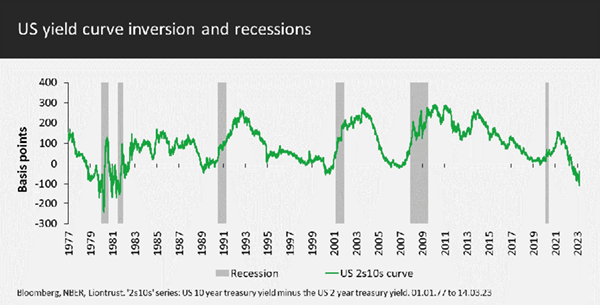
We believed the curve had gone too far and have implemented curve steepening trades. At this time, risk assets (credit, equities etc) had not reacted to the recessionary message the sovereign bond market was sending, so we thought it was prudent to reduce credit to just below neutral.
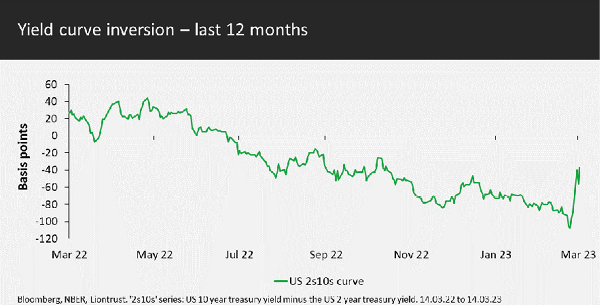
In the very short term, events have played nicely towards our portfolio positioning. The SVB failure has led investors to rapidly reappraise their expectations of near-term policy tightening in the US. This pushed the 2-year government bond yield lower, roughly halving yield curve inversion between the 2 year and 10 year level from around 110 basis points to under 50. We closed out our steepener position but we will reinstate it if inversion increases significantly.
At the time of writing, investors are increasingly concerned over the risk of SVB’s troubles becoming systemic to the banking sector, with Credit Suisse also falling victim to a self-prophetic spiral of deposit flight and liquidity worries. Ultimately, the banking system relies on confidence; without it, all banks would be vulnerable to a deposit run at some point. In this regard, the regulators appear to be acting swiftly to restore investor and depositor confident. In the meantime, all our funds are underweight credit risk in the financial sector, with low exposure to the more subordinated debt structures, which should provide some measure of insulation from the potential for sector nervousness to snowball.
Looking ahead to the rest of 2023, the SVB failure has accelerated the bond market’s transition to more historically normal levels of market volatility. In this environment, we believe that bond investors will continue to be rewarded for being active as market sentiment and asset valuations oscillate between the prospects of soft and hard landings.
KEY RISKS
Past performance is not a guide to future performance. The value of an investment and the income generated from it can fall as well as rise and is not guaranteed. You may get back less than you originally invested.
The issue of units/shares in Liontrust Funds may be subject to an initial charge, which will have an impact on the realisable value of the investment, particularly in the short term. Investments should always be considered as long term.
Investment in Funds managed by the Global Fixed Income team involves foreign currencies and may be subject to fluctuations in value due to movements in exchange rates. The value of fixed income securities will fall if the issuer is unable to repay its debt or has its credit rating reduced. Generally, the higher the perceived credit risk of the issuer, the higher the rate of interest. Bond markets may be subject to reduced liquidity. The Funds may invest in emerging markets/soft currencies which may have the effect of increasing volatility. Some of the Funds may invest in derivatives. The use of derivatives may create leverage or gearing. A relatively small movement in the value of a derivative's underlying investment may have a larger impact, positive or negative, on the value of a fund than if the underlying investment was held instead.
DISCLAIMER
This is a marketing communication. Before making an investment, you should read the relevant Prospectus and the Key Investor Information Document (KIID), which provide full product details including investment charges and risks. These documents can be obtained, free of charge, from www.liontrust.co.uk or direct from Liontrust. Always research your own investments. If you are not a professional investor please consult a regulated financial adviser regarding the suitability of such an investment for you and your personal circumstances.
This should not be construed as advice for investment in any product or security mentioned, an offer to buy or sell units/shares of Funds mentioned, or a solicitation to purchase securities in any company or investment product. Examples of stocks are provided for general information only to demonstrate our investment philosophy. The investment being promoted is for units in a fund, not directly in the underlying assets. It contains information and analysis that is believed to be accurate at the time of publication, but is subject to change without notice. Whilst care has been taken in compiling the content of this document, no representation or warranty, express or implied, is made by Liontrust as to its accuracy or completeness, including for external sources (which may have been used) which have not been verified. It should not be copied, forwarded, reproduced, divulged or otherwise distributed in any form whether by way of fax, email, oral or otherwise, in whole or in part without the express and prior written consent of Liontrust.


