The Liontrust Strategic Bond Fund returned 0.5%* in sterling terms in December. The average return from the IA Sterling Strategic Bond sector, the Fund’s comparator benchmark, was 0.1%.
Market backdrop
The mainstream news has saturated coverage of the omicron variant, and its relative infectiousness and virulence, so I shall focus my attention in this commentary on more mundane matters such as central banking actions. I find the whole monetary policy manipulation paradigm fascinating, but that probably says more about me than it should!
The US Federal Reserve increased its pace of tapering (slowing the amount of quantitative easing they are doing), with the end now anticipated to be in March. The dot plots now show a median forecast of three rate rises in 2022; there are a further three increases forecast in 2023, albeit with a greater disparity of views amongst the committee. The Bank of England had delayed raising rates at its November meeting but dutifully delivered in December. An honourable mention has to go to other countries seeing rate rises given how prolific monetary tightening is around the world. In December, the list included Norway, Czechia, Poland, Hungary, Brazil, Mexico and Chile.
One jurisdiction that remains steadfastly addicted to having loose policy is the Eurozone. The ECB is letting the emergency bond buying PEPP programme expire, but slightly increasing the asset purchase programme (APP) to offset some of this; quantitative easing may be stopped by the end of 2022, and they have guided that any rate rise won’t be until 2023. It is absurd given where inflation and growth are currently and forecast to be, but in a fiat economy you can get away with financial repression for long periods of time (but when it eventually goes wrong, it goes very wrong).
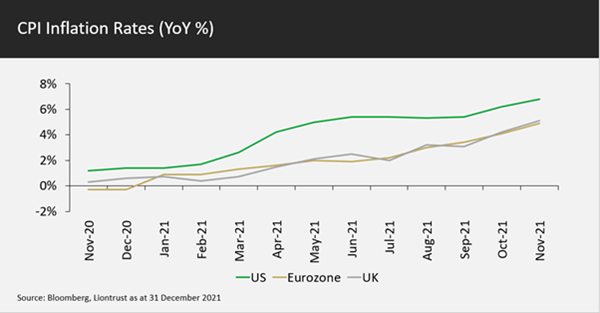
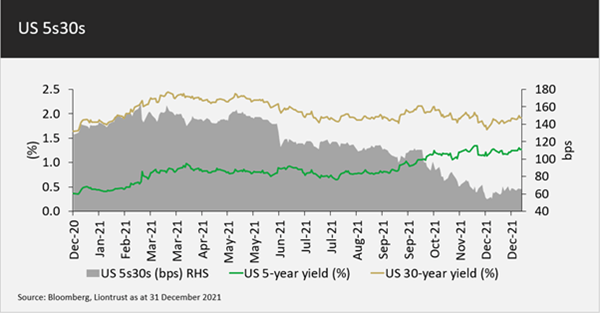
For 2022, one of the key themes for bond markets will be whether central bankers are deemed to be “behind the curve” or, in layman’s terms, too slow to raise rates. In 2021, the word “transitory” to describe inflation was officially retired by the Fed I look forward to seeing what terms they use to describe large negative real rates in 2022. If I had to summarise bond markets in 2021 in two charts, I would use the following:


The first chart shows the progression in consumer price inflation (CPI) across the US, Eurozone and UK in 2021. Headline CPI will start to fall in the US in early 2022 as the impact of energy price rises fade but core CPI will continue to rise. Energy prices feed through to CPI with more of a lagged effect in Europe and the UK, so one should expect a peak in CPI sometime around Q2.
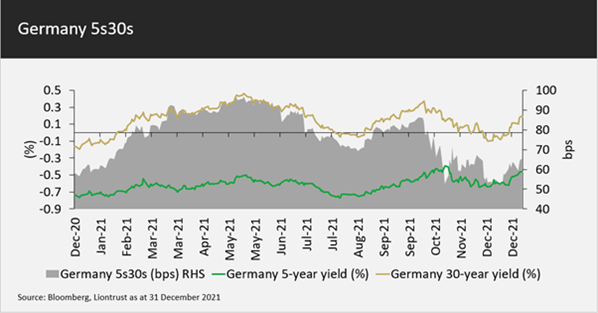
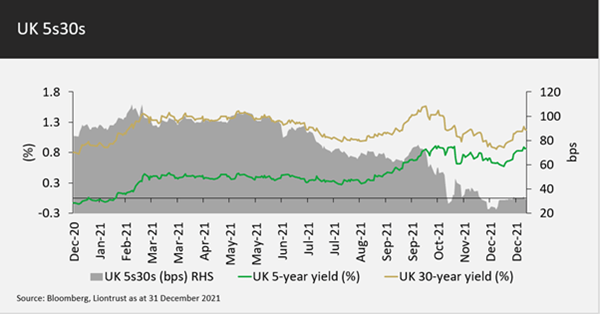
If you’d told me a few years ago we’d see these inflation levels coupled with dovish central banks (in the US and Eurozone), I’d have bet on bond markets flexing their muscles and trying to demand higher yields. The bond market story of 2021 appeared to be more of a reluctant acceptance of a low yield paradigm. Examining the second chart, the green line is the 5-year US Treasury yield, which rose from 0.35% to 1.25% in 2021, thus pricing in the first few rates rises. The gold line shows the 30-year US Treasury yield, which peaked in the first quarter and rallied significantly since. The theory here is that the Fed tightening monetary policy will choke off growth and lead to a low peak in interest rates. This can be seen by the shaded area showing the difference in yields between 5 and 30-year Treasuries; there has been a huge curve flattening. I’ve shown the same charts for Germany and the UK at the end of this document for those interested.
But what if growth remains stronger given that fiscal policy is still loose and there are huge excess savings to be spent? Or what if inflation remains significantly above central bank targets for the next few years and the bond markets demand more of a “term premium” for owning longer dated debt? Or maybe economies will be strong enough to cope with positive real interest rates? If any of these scenarios occur, then longer dated bonds look vulnerable. For our more detailed thoughts on the outlook please see our strategy piece.
Rates
The Fund has a core strategic position of having a low beta duration exposure with approximately 2 years† in the Dollar bloc countries and 1 year in Europe including Switzerland. The preference for intermediate maturities of the curve, the 5 to 15-year tenors, remains in place. We hope to see the US 5s30s curve flatten further to 50bps in order to instigate a strategic steepening position.
During December, we took profits on the relative value trade of being long Canadian 5-year bonds relative to the US. This leaves the Fund now short 0.25 years 10-year Canadian bond futures, with about 2.25 years of US Treasury duration. Rounding off on the Dollar bloc, the Fund retains a cross-market position being 0.5 years short Australian 10-year bond futures versus a corresponding long in New Zealand government bonds.
Within Europe, the spread between Switzerland and Germany narrowed during December and is approaching the flat yield level at which we’d take profit. Finally, we tactically added 0.25 years UK Gilt duration in the selloff during thin markets between Christmas and New Year. This is very much tactical in nature, temporarily taking the Fund to 3.25 years to exploit year-end volatility; we anticipate making a quick profit on this in early January.
Allocation
Having used the volatility in November to increase the Fund’s high yield exposure to 27.5%, we then took advantage of the rally in December to trim the position back to just below 25% (23.3% in physical holdings plus a 1.1% overlay). For liquidity reasons, we used the iTraxx Xover (credit default swap index), reducing exposure to just below 250bps spread. The Fund is still overweight in high yield compared to our 20% neutral position, but very much has a quality bias within the holdings.
Investment grade exposure is approximately 43% (48% physical holdings minus a 5% overlay), underweight compared to a 50% neutral positioning stance. This underweight position is due to expensive valuations; we anticipate there will be a better chance to buy credit during 2022.
Selection
December was a quiet month for stock level activity. We sold some long-dated US dollar denominated Vodafone bonds with a high cash price of about 127 cents (in the dollar). As private equity activity continues to increase one needs to be aware of leverage buyout risks; bondholders are generally protected by change of control covenants which normally give bondholders the right to put the bonds back to the company at a price of 101 in the event of a takeover. Although we believe the likelihood of a private equity bid for Vodafone is very low, the risk/return (given the difference between 127 and 101) made it prudent to sell; we retain a different Vodafone bond that has a price close to par.
Appendix


Discrete 12 month performance to last quarter end (%)**:
|
Dec-21 |
Dec-20 |
Dec-19 |
|
|
Liontrust Strategic Bond B Acc |
-0.47% |
5.87% |
8.70% |
|
IA Sterling Strategic Bond |
0.77% |
6.55% |
9.26% |
*Source: Financial Express, as at 31.12.2021, accumulation B share class, total return (net of fees and income reinvested.
**Source: Financial Express, as at 31.12.2021, accumulation B share class, total return (net of fees and income reinvested. Discrete data is not available for five full 12 month periods due to the launch date of the portfolio.
Fund positioning data sources: UBS Delta, Liontrust.
†Adjusted underlying duration is based on the correlation of the instruments as opposed to just the mathematical weighted average of cash flows. High yield companies' bonds exhibit less duration sensitivity as the credit risk has a bigger proportion of the total yield; the lower the credit quality the less rate-sensitive the bond. Additionally, some subordinated financials also have low duration correlations and the bonds trade on a cash price rather than spread.
Key Risks


